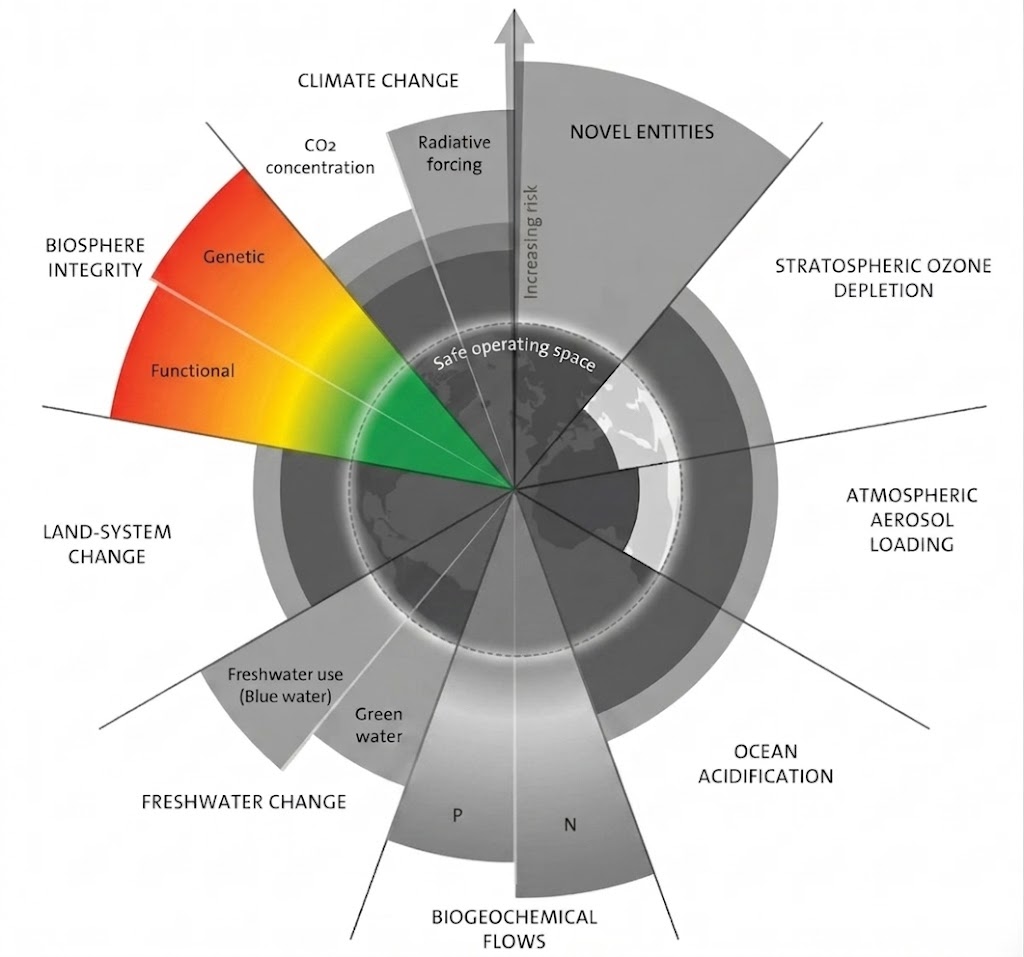
The boundary was originally framed in 2009 (Rockström et al.) as "biodiversity loss," with one control variable: the species extinction rate. In the 2015 update (Steffen et al.), it was renamed "biosphere integrity" and a second dimension was added. The 2023 framework update (Richardson et al., Science Advances) and the 2024 review (Rockström et al., Nature Reviews Earth & Environment) confirmed the two-dimension structure and named biosphere integrity, along with climate change, as one of the two "core" planetary boundaries. These are the boundaries that, by themselves, can drive the Earth system into a new state if pushed too far.
The two dimensions are kept separate for a reason. They capture different things.
1. Genetic diversity (Extinctions per Million Species-Years, E/MSY). This measures how fast species are being permanently lost. Extinction is irreversible. Once a lineage disappears, the evolutionary information it contained, including potential adaptations to future conditions we cannot predict, is gone for good. This dimension captures the long-term resilience and adaptive capacity of life on Earth.
2. Functional integrity (Human Appropriation of Net Primary Production, HANPP, and the Biodiversity Intactness Index, BII). This measures whether ecosystems are still doing their job right now. You can have lots of species present but a degraded ecosystem if the species composition has shifted toward generalists, or if humans are siphoning off so much of the plant productivity that little remains for everything else.
As Rockström and colleagues put it in 2024: "genetic diversity does not capture the function of living organisms, initiating the provisional use of the Biodiversity Intactness Index as a second control variable… PB 3.0 recommended human appropriation of net primary production (HANPP) as the control variable for functional biosphere integrity" (Rockström et al., 2024). One metric would have hidden either problem behind the other. Two metrics force you to look at both irreversibility and current function.
Adapted from: Azote for Stockholm Resilience Centre, based on analysis in Sakschewski and Caesar et al. 2025.
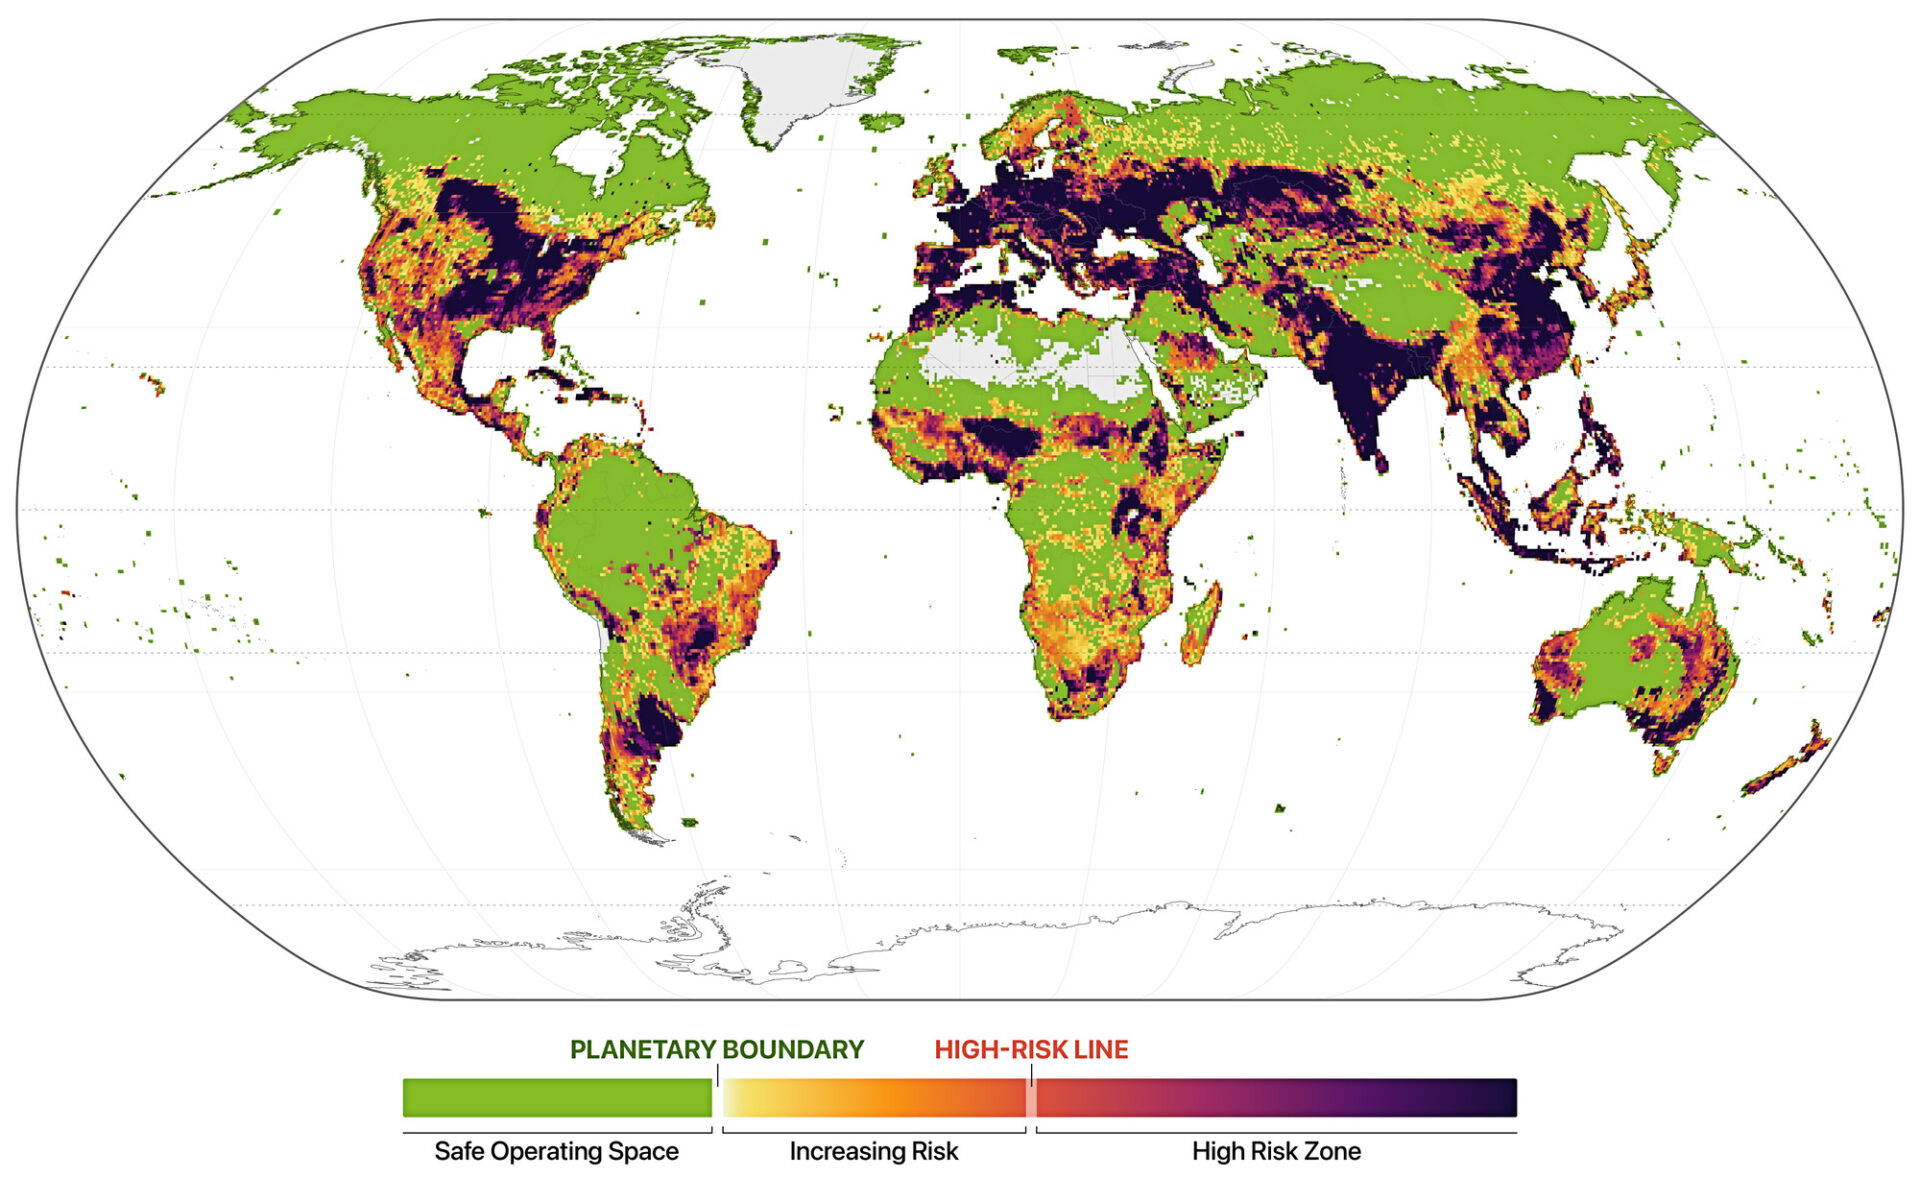
Global risk map of the Change in Biosphere Integrity, based on the functional integrity (HANPP) control variable. Transgression is based on the HANPP control variable. All values shown on the map refer to the year 2010. Based on data from Kastner et al. 2022.
Most discussion of biodiversity risk for business is framed around disclosure: TNFD, CSRD ESRS E4, SBTN. Those frameworks matter, but they are downstream of the actual problem. The actual problem is that the physical inputs to your supply chain are eroding. Even if no regulator asked you to report on it, the costs would land on your operations.
Pollination is not a metaphor. Around 75% of the world's leading crop types depend on animal pollination to some degree, accounting for roughly 35% of global food production volume (Klein et al., 2007). Pollinator-dependent crops carry more than 90% of vitamin C, the entire global supply of lycopene, and most lipids and fat-soluble vitamins in the human food supply (Eilers et al., PLOS ONE 2011). Pollinator populations are not just declining; in places they have collapsed. North American studies by Cameron and colleagues (PNAS 2011) found four bumblebee species have lost up to 96% of their relative abundance and 23 to 87% of their geographic range, and the IUCN now lists 25.8% of Europe's bumblebee species as threatened with extinction.
Natural pest control is a multi-billion-dollar service. US bats alone provide pest control services to agriculture estimated at $3.7 to $53 billion per year (Boyles et al., Science 2011). Insect natural enemies attacking crop pests in the US alone were valued at $5.5 billion per year by Naranjo, Frisvold and Croft in their 2015 Annual Review of Entomology paper, a figure they describe as "very conservative." When these populations crash, your supplier either pays for chemical replacements or accepts yield loss. Both flow through to commodity prices.
Soil microbiomes underpin agricultural productivity. Mycorrhizal fungi form symbiotic associations with more than 80% of land plant species, including most major crops (Brachmann & Parniske, PLOS Biology 2006). They deliver phosphorus to plants in exchange for carbon and provide drought tolerance. Heavy tillage, monoculture, and synthetic fertilizer use all degrade this network. Fields with disrupted mycorrhizal networks need more inputs to produce the same yield.
Sector-specific physical exposure:
The Dasgupta Review, commissioned by the UK Treasury, found that the global stock of natural capital per person fell by nearly 40% between 1992 and 2014. Most companies are not measuring their dependencies on this stock.
Defaunation is not the same as deforestation, but they ride together. A forest can still be standing and still be ecologically empty. Dirzo and colleagues coined "defaunation" specifically to make this visible. Their 2014 Science paper showed that 322 vertebrate species had become extinct since 1500 and remaining vertebrate populations had declined 25% on average. They wrote that "defaunation" should be considered "in the same sense as deforestation, a term that is now readily recognized" (Dirzo et al. 2014). The forest looks fine from a satellite. The seed-dispersing birds and mammals that keep it regenerating may already be gone.
Functional and taxonomic diversity are different things. You can lose 30% of species in a habitat and lose almost no function, if the survivors do the same jobs. Or you can lose 5% and lose a critical function entirely, if the species you lost was the only one performing it. Conservation that focuses on species lists rather than functional roles can technically succeed while ecosystems quietly fail.
Biodiversity loss is irreversible in a way climate change is not. This is the part that does not get said enough. If we somehow stopped CO₂ emissions tomorrow, the climate would slowly stabilize. If we somehow stopped all extinctions tomorrow, we would not get back the species we have already lost. Evolution operates on geological timescales. The biosphere is the one planetary boundary where every transgression is permanent.
The biosphere boundary is plumbed into the others. Biosphere integrity is the central node of the planetary boundaries system. Climate change accelerates extinctions. Nutrient loading from the nitrogen and phosphorus boundary degrades habitats. Freshwater change reshapes ecosystems. And the biosphere in turn regulates the carbon sink that buffers the climate boundary. Rockström and colleagues identify climate change and biosphere integrity as the two "core" boundaries for exactly this reason: "the 'core boundaries' (change in biosphere integrity, climate change) control the Earth system state through geological time" (Rockström et al. 2024). You cannot move one without moving the other.
Crop genetic diversity is collapsing too. The FAO estimates that around 75% of crop genetic diversity has been lost since 1900. Thailand went from 16,000 rice varieties to 37 in less than a century (FAO). Even our agricultural species are losing the internal genetic library that lets them respond to new pests, droughts, and heat.
Shifting baseline syndrome. Each generation calibrates "normal" against what they grew up with. A British farmer in 2026 remembers nettle-rich field edges; a farmer in 1926 remembered fields humming with insects. We are gradually accepting more impoverished ecosystems as default. Long-term monitoring datasets, like the German insect study, are the only defence against this drift.
Biosphere integrity is the planetary boundary most likely to affect your supply chain through physical effects, regardless of where regulation lands. The pollinators, soil microbes, water-purifying organisms, pest-controlling predators, and grazing-cycle workers your suppliers depend on are in measurable decline. The crops your suppliers grow rely on a narrowing genetic base. Reefs, fisheries, forests, and grasslands are all losing function faster than they can recover.
The good news, if there is one, is that biodiversity often responds quickly when pressure is reduced. Habitat patches, hedgerows, reduced pesticide load, healthier soils, and protected areas all show measurable recovery in years, not decades. Sustainability managers in mid-sized companies tend to have more direct influence over their supply chain practices than they assume. That is where to start. Map the dependency, find the pressure points, and act on them before they show up in unit economics.
What is the biosphere integrity planetary boundary? Biosphere integrity is one of nine planetary boundaries defined by the Stockholm Resilience Centre. It tracks whether the living systems of Earth can continue to regulate the planet. It is measured in two dimensions: genetic diversity (species extinction rates, in extinctions per million species-years) and functional integrity (human appropriation of net primary production, plus the Biodiversity Intactness Index). Both dimensions are currently transgressed. Biosphere integrity, along with climate change, is one of the two "core" boundaries whose breach can on its own drive the Earth system into a new state.
Why are there two metrics for biosphere integrity rather than one? Because they measure different things. Extinction rates capture irreversibility — once a species is gone, the evolutionary information is gone. HANPP and BII capture current ecosystem function — whether ecosystems are still pollinating, filtering, regulating climate, and supporting other life right now. You can have one go wrong without the other showing it. Both have to be tracked. As the Stockholm Resilience Centre team explained when proposing HANPP as the second variable in 2023, genetic diversity alone "does not capture the function of living organisms."
What is the Biodiversity Intactness Index? The Biodiversity Intactness Index (BII) measures the average abundance of originally present species in a habitat, relative to an undisturbed baseline. A BII of 100% means an ecosystem is intact. The planetary boundary safe limit is set at 90%. The global average has fallen to about 84.6%, with more than half of Earth's land surface below the safe limit (Newbold et al., Science 2016).
Why should manufacturing or fashion companies care about biodiversity? Because the physical inputs they depend on come from ecosystems. Cotton yields rise 12 to 24% with healthy native pollinator populations. Wool and leather depend on grazing systems whose productivity is maintained by dung beetles and soil microbes. Cellulosic textiles depend on intact forests. Chemicals and materials companies have more than half their supply chain value moderately or highly dependent on nature. None of this is hypothetical. It is already showing up in commodity prices and yield variance.
How does biosphere integrity relate to climate change? The two are tightly coupled. The biosphere is a major carbon sink — forests, soils, ocean plankton, and yes, Antarctic krill all absorb CO₂. As biosphere integrity erodes, that sink shrinks, accelerating climate change. Climate change in turn drives habitat loss and species range shifts, accelerating biodiversity loss. Rockström and colleagues describe climate change and biosphere integrity as the two "core" planetary boundaries whose interaction governs the overall state of the Earth system.